College Football Rankings 2020: Big Ten, Pac-12, Mountain West, MAC Begin Play
October 20, 2020 – by Jason Lisk

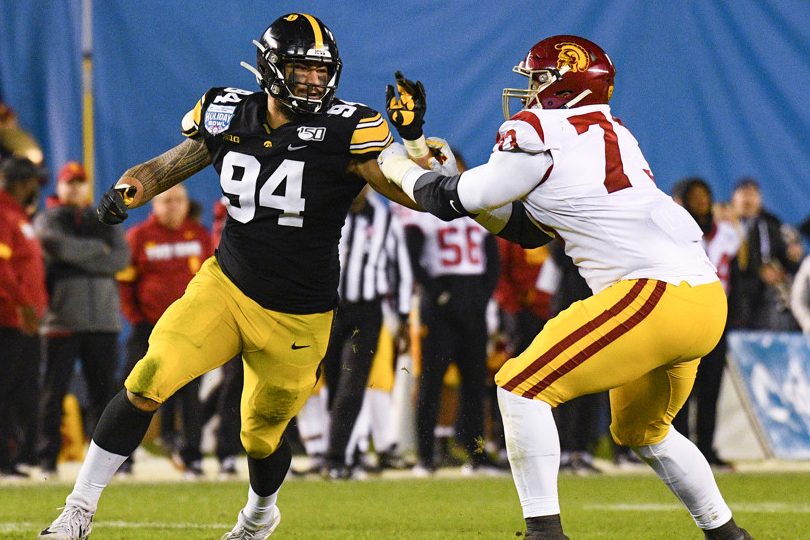
Iowa and USC are both back soon (Photo by Brian Rothmuller/Icon Sportswire)
Nearly two months after other conferences began play in 2020, the Big Ten, Pac-12, Mountain West, and MAC will make their returns over the next few weeks. These conferences will now be eligible for the bowl games and the College Football Playoff.
As a result, for the first time, we’ve created “preseason” rankings for a bunch of teams about to start play, even though the college football season has been underway for a while.
In this post, you can also see where we would slot the teams from these conferences in with the preseason rankings for other schools that have already been playing, by looking at our updated TR Top 25.
If you’d like to learn about the methodology behind our mostly data-driven preseason team ratings, make sure your read our post on How We Make College Football Preseason Rankings.
NFL Week 1 Picks
Betting – Survivor – Pick’em
Start Free TrialGet The Season
The Updated 2020 TeamRankings College Football Top 25
Jump to rankings for all Big Ten, MAC, Mountain West and Pac-12 teams
Back in August we published our original 2020 Top 25 preseason college football rankings, which considered the 77 teams that were planning to play a 2020 fall season at the time. That list excluded the teams from the conferences that had announced they would not play in the fall.
Now that other schools are going to play and we’ve compiled preseason ratings for all of them, you may be curious about where we would have slotted all teams into our preseason rankings before any team played a game.
Here is what our preseason Top 25 would have looked like if all college football teams had started at the same time this year. Yes, Ohio State would have been above Clemson and Alabama.
| TR Rank | Team | 2020 Rating | LAST YEAR | PROGRAM | RETURNING | LUCK | MARKET |
|---|---|---|---|---|---|---|---|
| 1 | Ohio State | 30.6 | 28.9 | 6.1 | -1.1 | -3.4 | 0.0 |
| 2 | Clemson | 29.3 | 23.3 | 5.8 | 2.5 | -1.3 | -1.0 |
| 3 | Alabama | 27.1 | 21.5 | 6.7 | -3.3 | -0.8 | 3.0 |
| 4 | Georgia | 21.8 | 16.6 | 2.9 | -2.1 | -0.5 | 5.0 |
| 5 | Oklahoma | 19.9 | 13.2 | 4.5 | -3.5 | 1.8 | 4.0 |
| 6 | Wisconsin | 19.5 | 17.8 | 4.1 | 4.5 | -1.0 | -6.0 |
| 7 | Louisiana State | 18.8 | 24.4 | 3.3 | -9.8 | -2.2 | 3.0 |
| 8 | Penn State | 18.8 | 16.5 | 4.6 | 2.0 | -1.3 | -3.0 |
| 9 | Notre Dame | 17.8 | 14.6 | 2.7 | -2.3 | -0.3 | 3.0 |
| 10 | Texas A&M | 16.8 | 8.8 | 2.0 | 3.5 | 0.5 | 2.0 |
| 11 | Oregon | 16.6 | 14.9 | 0.8 | 0.8 | -2.9 | 3.0 |
| 12 | Florida | 16.4 | 14.9 | 1.6 | -0.3 | -0.8 | 1.0 |
| 13 | Auburn | 15.6 | 15.6 | 4.0 | 2.1 | -1.2 | -5.0 |
| 14 | USC | 15.4 | 6.0 | 3.1 | 6.0 | 2.3 | -2.0 |
| 15 | Texas | 15.1 | 9.4 | 1.6 | 2.0 | 0.1 | 2.0 |
| 16 | Michigan | 13.7 | 14.0 | 4.8 | -2.0 | -0.1 | -3.0 |
| 17 | Central Florida | 13.5 | 10.3 | 1.9 | 3.5 | -0.2 | -2.0 |
| 18 | Oklahoma State | 13.4 | 6.0 | 3.1 | 5.5 | 0.9 | -2.0 |
| 19 | Boise State | 11.6 | 4.2 | 1.8 | 1.3 | 0.4 | 4.0 |
| 20 | Minnesota | 11.2 | 9.2 | 1.1 | -0.6 | 0.5 | 1.0 |
| 21 | North Carolina | 10.2 | 6.7 | 0.4 | 4.6 | -1.5 | 0.0 |
| 22 | Iowa State | 9.8 | 7.2 | 1.0 | -0.1 | 0.7 | 1.0 |
| 23 | Baylor | 9.1 | 10.8 | 0.0 | -1.9 | -1.8 | 2.0 |
| 24 | Kentucky | 8.6 | 4.9 | 0.3 | 2.8 | -0.3 | 1.0 |
| 25 | Washington | 8.4 | 9.4 | 4.8 | -3.4 | -0.5 | -2.0 |
While we encourage you to read our full preseason rankings methodology, here’s a quick reminder of the factors we currently use in our preseason ratings:
LAST YEAR: How good a team was last yearPROGRAM: How consistently good a team has been in recent history (excluding last year)RETURN: A measure of how much performance in key stat areas last year came from players returning this yearLUCK: A measure of how likely a team is to improve in higher-variance metrics like turnoversMARKET: An adjustment made if our initial projection is far off the AP Poll and/or betting market
Updated College Football Preseason Rankings Highlights
Ohio State would have been our preseason No. 1, and this was largely driven by their power rating from last season.USC has both the largest returning starter adjustment and luck adjustment, which would have had them at No. 14 in our preseason rankings, and is why the Trojans are expected to compete for the Pac-12 title coming off a disappointing 8-5 season in 2019.Wisconsin was our biggest downward market adjustment, by 6 points, meaning that our raw ratings were actually six points higher but we made that adjustment to move toward the betting markets. Still, Wisconsin comes in at No. 6 with that adjustment.
Updated 2020 Full TeamRankings College Football Rankings (Now Including Big Ten, MAC, Mountain West, and Pac-12)
Finally, here are our initial “preseason” 2020 college football ratings for every team. All the teams from the conferences starting play late are now included.
Keep in mind that in the table below, we’re showing the preseason ratings for some teams that have already played several games. So, some numbers may be surprising for teams that have played much better or much worse than expected so far (e.g., Oklahoma and LSU are no longer 5th and 7th in our current rankings).
But the point here is to compare apples to apples, and have a record of our preseason rating for every team, before any of them played a game this year.
If you want to see where the new teams slot compared to all other FBS teams now, and get the most current predictive ratings, you can check out our NCAA College Football Predictive Rankings and Ratings page.
| TR Rank | Team | 2020 Rating | LAST YEAR | PROGRAM | RETURNING | LUCK | MARKET |
|---|---|---|---|---|---|---|---|
| 1 | Ohio State | 30.6 | 28.9 | 6.1 | -1.1 | -3.4 | 0.0 |
| 2 | Clemson | 29.3 | 23.3 | 5.8 | 2.5 | -1.3 | -1.0 |
| 3 | Alabama | 27.1 | 21.5 | 6.7 | -3.3 | -0.8 | 3.0 |
| 4 | Georgia | 21.8 | 16.6 | 2.9 | -2.1 | -0.5 | 5.0 |
| 5 | Oklahoma | 19.9 | 13.2 | 4.5 | -3.5 | 1.8 | 4.0 |
| 6 | Wisconsin | 19.5 | 17.8 | 4.1 | 4.5 | -1.0 | -6.0 |
| 7 | Louisiana State | 18.8 | 24.4 | 3.3 | -9.8 | -2.2 | 3.0 |
| 8 | Penn State | 18.8 | 16.5 | 4.6 | 2.0 | -1.3 | -3.0 |
| 9 | Notre Dame | 17.8 | 14.6 | 2.7 | -2.3 | -0.3 | 3.0 |
| 10 | Texas A&M | 16.8 | 8.8 | 2.0 | 3.5 | 0.5 | 2.0 |
| 11 | Oregon | 16.6 | 14.9 | 0.8 | 0.8 | -2.9 | 3.0 |
| 12 | Florida | 16.4 | 14.9 | 1.6 | -0.3 | -0.8 | 1.0 |
| 13 | Auburn | 15.6 | 15.6 | 4.0 | 2.1 | -1.2 | -5.0 |
| 14 | USC | 15.4 | 6.0 | 3.1 | 6.0 | 2.3 | -2.0 |
| 15 | Texas | 15.1 | 9.4 | 1.6 | 2.0 | 0.1 | 2.0 |
| 16 | Michigan | 13.7 | 14.0 | 4.8 | -2.0 | -0.1 | -3.0 |
| 17 | Central Florida | 13.5 | 10.3 | 1.9 | 3.5 | -0.2 | -2.0 |
| 18 | Oklahoma State | 13.4 | 6.0 | 3.1 | 5.5 | 0.9 | -2.0 |
| 19 | Boise State | 11.6 | 4.2 | 1.8 | 1.3 | 0.4 | 4.0 |
| 20 | Minnesota | 11.2 | 9.2 | 1.1 | -0.6 | 0.5 | 1.0 |
| 21 | North Carolina | 10.2 | 6.7 | 0.4 | 4.6 | -1.5 | 0.0 |
| 22 | Iowa State | 9.8 | 7.2 | 1.0 | -0.1 | 0.7 | 1.0 |
| 23 | Baylor | 9.1 | 10.8 | 0.0 | -1.9 | -1.8 | 2.0 |
| 24 | Kentucky | 8.6 | 4.9 | 0.3 | 2.8 | -0.3 | 1.0 |
| 25 | Washington | 8.4 | 9.4 | 4.8 | -3.4 | -0.5 | -2.0 |
| 26 | Tennessee | 8.3 | 3.4 | 0.5 | 2.0 | 1.4 | 1.0 |
| 27 | Virginia Tech | 8.2 | 2.1 | 2.6 | 1.6 | -0.1 | 2.0 |
| 28 | Appalachian State | 7.9 | 7.2 | 0.8 | 3.7 | -0.7 | -3.0 |
| 29 | Miami | 7.7 | 1.8 | 3.0 | -3.9 | -0.3 | 7.0 |
| 30 | Memphis | 7.2 | 9.4 | 1.6 | -0.5 | 0.8 | -4.0 |
| 31 | Texas Christian | 7.0 | 4.8 | 2.0 | 0.6 | 0.7 | -1.0 |
| 32 | Nebraska | 7.0 | 2.9 | 0.5 | -0.4 | 1.0 | 3.0 |
| 33 | Cincinnati | 6.8 | 6.9 | -2.0 | 1.8 | -1.0 | 1.0 |
| 34 | Louisville | 6.5 | 1.3 | 2.6 | 3.4 | 0.2 | -1.0 |
| 35 | Indiana | 6.2 | 5.3 | 0.6 | 2.7 | 0.5 | -3.0 |
| 36 | Navy | 6.1 | 8.7 | 0.6 | -1.2 | -2.0 | 0.0 |
| 37 | Iowa | 5.9 | 11.2 | 2.5 | 0.2 | -1.0 | -7.0 |
| 38 | Utah | 5.8 | 12.5 | 1.8 | -5.7 | -1.8 | -1.0 |
| 39 | California | 5.8 | 1.2 | 0.3 | 1.7 | -0.4 | 3.0 |
| 40 | Kansas State | 5.7 | 6.1 | 1.8 | 0.3 | 1.5 | -4.0 |
| 41 | Wake Forest | 5.4 | 1.0 | 0.9 | -2.4 | -1.1 | 7.0 |
| 42 | Florida State | 4.9 | 1.1 | 2.5 | 0.5 | 0.8 | 0.0 |
| 43 | Mississippi | 4.8 | 3.2 | 0.4 | 1.5 | 0.7 | -1.0 |
| 44 | Arizona St | 4.6 | 2.3 | 0.2 | -1.3 | -0.6 | 4.0 |
| 45 | Air Force | 4.0 | 6.2 | -0.4 | 0.7 | -0.4 | -2.0 |
| 46 | Stanford | 3.7 | -2.0 | 2.7 | 2.3 | 0.7 | 0.0 |
| 47 | Virginia | 3.6 | 4.2 | -1.0 | -3.8 | 0.3 | 4.0 |
| 48 | Houston | 3.4 | -1.2 | 1.0 | 5.1 | 1.4 | -3.0 |
| 49 | South Carolina | 3.3 | 3.4 | 0.1 | -1.2 | 0.0 | 1.0 |
| 50 | Pittsburgh | 2.7 | -0.9 | 1.1 | 0.2 | 0.3 | 2.0 |
| 51 | UL Lafayette | 2.6 | 6.7 | -3.2 | 1.8 | -1.8 | -1.0 |
| 52 | Mississippi State | 2.6 | 3.2 | 1.6 | -2.9 | -0.3 | 1.0 |
| 53 | West Virginia | 2.2 | -3.4 | 1.9 | 1.5 | 0.2 | 2.0 |
| 54 | UCLA | 2.1 | -2.7 | 0.5 | 2.9 | 1.4 | 0.0 |
| 55 | Tulane | 1.8 | 3.5 | -1.4 | -2.6 | 0.3 | 2.0 |
| 56 | Tulsa | 1.7 | -0.9 | -0.1 | 3.1 | -0.3 | 0.0 |
| 57 | Southern Methodist | 1.7 | 4.5 | -1.4 | -2.1 | -0.4 | 1.0 |
| 58 | Texas Tech | 1.4 | 0.1 | 0.8 | -0.5 | -0.1 | 1.0 |
| 59 | Boston College | 1.2 | -2.1 | 0.3 | 1.4 | 0.7 | 1.0 |
| 60 | Missouri | 1.0 | 3.7 | 0.7 | -1.3 | -0.2 | -2.0 |
| 61 | Duke | 0.9 | -1.7 | 0.6 | -0.6 | 0.6 | 2.0 |
| 62 | Northwestern | 0.8 | -2.7 | 2.0 | 5.7 | 0.8 | -5.0 |
| 63 | Michigan St | -0.2 | 3.9 | 1.3 | -4.2 | -0.1 | -1.0 |
| 64 | Purdue | -0.5 | -0.5 | -0.5 | 3.4 | 0.2 | -3.0 |
| 65 | UAB | -0.5 | -7.4 | -2.4 | 4.3 | 0.0 | 5.0 |
| 66 | Brigham Young | -0.7 | -0.7 | 0.0 | 0.3 | -0.3 | 0.0 |
| 67 | Buffalo | -0.7 | -1.9 | -2.9 | 4.9 | -1.8 | 1.0 |
| 68 | Wash State | -0.8 | 4.2 | 2.4 | -8.5 | 1.0 | 0.0 |
| 69 | Illinois | -1.1 | -0.4 | -2.3 | 1.2 | -1.6 | 2.0 |
| 70 | San Diego St | -1.6 | -1.6 | 1.0 | 1.9 | -3.9 | 1.0 |
| 71 | Ohio | -1.9 | -3.2 | -0.1 | 2.1 | 0.4 | -1.0 |
| 72 | NC State | -1.9 | -7.7 | 1.8 | 2.5 | 0.4 | 1.0 |
| 73 | Syracuse | -2.8 | -3.0 | -0.6 | -3.3 | 1.0 | 3.0 |
| 74 | Western Kentucky | -3.0 | -2.2 | -0.2 | -1.0 | 0.4 | 0.0 |
| 75 | Georgia Southern | -3.6 | -3.7 | -2.2 | 1.5 | 0.8 | 0.0 |
| 76 | Army | -3.8 | -3.8 | 0.1 | -0.5 | 0.3 | 0.0 |
| 77 | Georgia Tech | -4.0 | -9.4 | 1.2 | 5.5 | -0.2 | -1.0 |
| 78 | Southern Miss | -4.2 | -4.2 | -1.5 | 0.6 | 0.9 | 0.0 |
| 79 | Maryland | -4.3 | -4.0 | -0.5 | -0.3 | 0.5 | 0.0 |
| 80 | Temple | -4.6 | -2.6 | 0.6 | -0.6 | -1.0 | -1.0 |
| 81 | South Florida | -4.6 | -6.9 | 1.0 | 2.5 | -1.3 | 0.0 |
| 82 | Arkansas | -4.7 | -7.4 | -0.3 | -0.5 | 1.3 | 2.0 |
| 83 | Colorado St | -5.2 | -8.4 | -0.5 | 2.4 | 3.3 | -2.0 |
| 84 | Arizona | -5.2 | -4.9 | -0.6 | -0.1 | 1.4 | -1.0 |
| 85 | Wyoming | -5.3 | -1.3 | -0.3 | 0.0 | -1.6 | -2.0 |
| 86 | Oregon St | -5.5 | 0.5 | -1.7 | -2.3 | -2.1 | 0.0 |
| 87 | Colorado | -6.1 | -2.5 | 1.5 | -2.1 | 0.0 | -3.0 |
| 88 | Kansas | -6.2 | -7.3 | -3.2 | -1.4 | 0.6 | 5.0 |
| 89 | Miami (OH) | -6.2 | -6.8 | -1.6 | 2.1 | 0.1 | 0.0 |
| 90 | Florida Atlantic | -6.7 | 5.5 | -2.0 | -10.3 | -3.9 | 4.0 |
| 91 | Toledo | -6.9 | -11.4 | 0.8 | 2.0 | 0.7 | 1.0 |
| 92 | W Michigan | -6.9 | -3.1 | 1.1 | -5.0 | -0.9 | 1.0 |
| 93 | Ball State | -7.1 | -4.1 | -4.0 | 3.4 | -0.4 | -2.0 |
| 94 | Troy | -7.2 | -8.0 | 0.2 | 0.2 | 0.4 | 0.0 |
| 95 | Rutgers | -7.9 | -13.4 | -2.6 | 2.5 | 1.5 | 4.0 |
| 96 | Louisiana Tech | -8.1 | -2.7 | -0.3 | -2.6 | -2.5 | 0.0 |
| 97 | Central Mich | -8.3 | -6.6 | -1.9 | 1.3 | 2.9 | -4.0 |
| 98 | Coastal Carolina | -8.4 | -8.6 | -3.8 | 0.6 | 0.4 | 3.0 |
| 99 | Marshall | -8.9 | -4.2 | -2.3 | -1.9 | -0.4 | 0.0 |
| 100 | Utah State | -9.0 | -4.8 | -0.6 | -3.8 | 0.2 | 0.0 |
| 101 | Rice | -9.0 | -10.0 | -4.8 | 4.9 | 1.0 | 0.0 |
| 102 | Georgia St. | -9.4 | -8.9 | -3.4 | 2.4 | 0.4 | 0.0 |
| 103 | Liberty | -9.5 | -6.5 | -1.6 | -5.9 | -0.5 | 5.0 |
| 104 | East Carolina | -9.9 | -10.3 | -3.3 | 3.1 | 0.6 | 0.0 |
| 105 | Arkansas St. | -9.9 | -6.0 | -0.7 | -3.6 | 0.3 | 0.0 |
| 106 | Charlotte | -9.9 | -8.5 | -4.5 | 3.1 | 0.0 | 0.0 |
| 107 | Fresno St | -10.2 | -5.4 | -1.1 | -1.2 | 0.6 | -3.0 |
| 108 | Middle Tennessee | -11.1 | -6.5 | -1.6 | 0.6 | -0.6 | -3.0 |
| 109 | UL Monroe | -11.3 | -8.4 | -3.8 | 0.2 | 0.8 | 0.0 |
| 110 | North Texas | -11.4 | -9.0 | -2.3 | -1.1 | 0.9 | 0.0 |
| 111 | Vanderbilt | -12.0 | -8.3 | -0.1 | -0.5 | -0.1 | -3.0 |
| 112 | N Illinois | -12.1 | -10.1 | -0.6 | -3.0 | 0.8 | 1.0 |
| 113 | Hawaii | -12.5 | -2.5 | -3.2 | -9.3 | 1.5 | 1.0 |
| 114 | Kent State | -13.2 | -7.0 | -3.8 | -1.6 | 0.1 | -1.0 |
| 115 | Texas-San Antonio | -13.8 | -15.5 | -2.1 | 2.3 | 1.5 | 0.0 |
| 116 | Nevada | -14.4 | -13.3 | -2.2 | 1.6 | 0.4 | -1.0 |
| 117 | South Alabama | -14.6 | -12.9 | -3.2 | -0.1 | 1.5 | 0.0 |
| 118 | New Mexico | -14.6 | -15.6 | -2.0 | 1.4 | 1.7 | 0.0 |
| 119 | Florida International | -14.6 | -9.0 | -3.1 | -3.4 | 0.9 | 0.0 |
| 120 | San Jose St | -14.8 | -7.4 | -4.2 | -0.2 | -1.0 | -2.0 |
| 121 | UNLV | -16.0 | -12.5 | -2.5 | 1.6 | 0.4 | -3.0 |
| 122 | E Michigan | -17.2 | -8.2 | -1.2 | -5.6 | -0.2 | -2.0 |
| 123 | Texas State | -21.8 | -14.1 | -6.0 | -2.3 | 0.6 | 0.0 |
| 124 | Akron | -26.4 | -27.6 | -2.5 | 2.6 | 0.0 | 1.0 |
| 125 | Bowling Grn | -27.1 | -22.6 | -3.8 | -1.2 | 0.5 | 0.0 |
| 126 | Texas El Paso | -29.8 | -20.9 | -5.3 | -4.9 | 1.3 | 0.0 |
| 127 | U Mass | -35.8 | -33.0 | -2.9 | -0.7 | 0.9 | 0.0 |
NFL Week 1 Picks
Betting – Survivor – Pick’em
Start Free TrialGet The Season
If you liked this post, please share it. Thank you! Twitter Facebook
NFL Football Pool Picks NFL Survivor Pool Picks NCAA Bracket Picks College Bowl Pool Picks College Football Pool Picks NFL Picks NBA Picks MLB Picks College Football Picks College Basketball Picks NFL Predictions NBA Predictions MLB Predictions College Football Predictions College Basketball Predictions NFL Spread Picks NBA Spread Picks MLB Spread Picks College Football Spread Picks College Basketball Spread Picks NFL Rankings NBA Rankings MLB Rankings College Football Rankings College Basketball Rankings NFL Stats NBA Stats MLB Stats College Football Stats College Basketball Stats NFL Odds NBA Odds MLB Odds College Football Odds College Basketball Odds A product ofTeamRankings BlogAboutTeamJobsContact
© 2005-2024 Team Rankings, LLC. All Rights Reserved. Statistical data provided by Gracenote.
TeamRankings.com is not affiliated with the National Collegiate Athletic Association (NCAA®) or March Madness Athletic Association, neither of which has supplied, reviewed, approved or endorsed the material on this site. TeamRankings.com is solely responsible for this site but makes no guarantee about the accuracy or completeness of the information herein.
Terms of ServicePrivacy Policy